The GPU is the engine
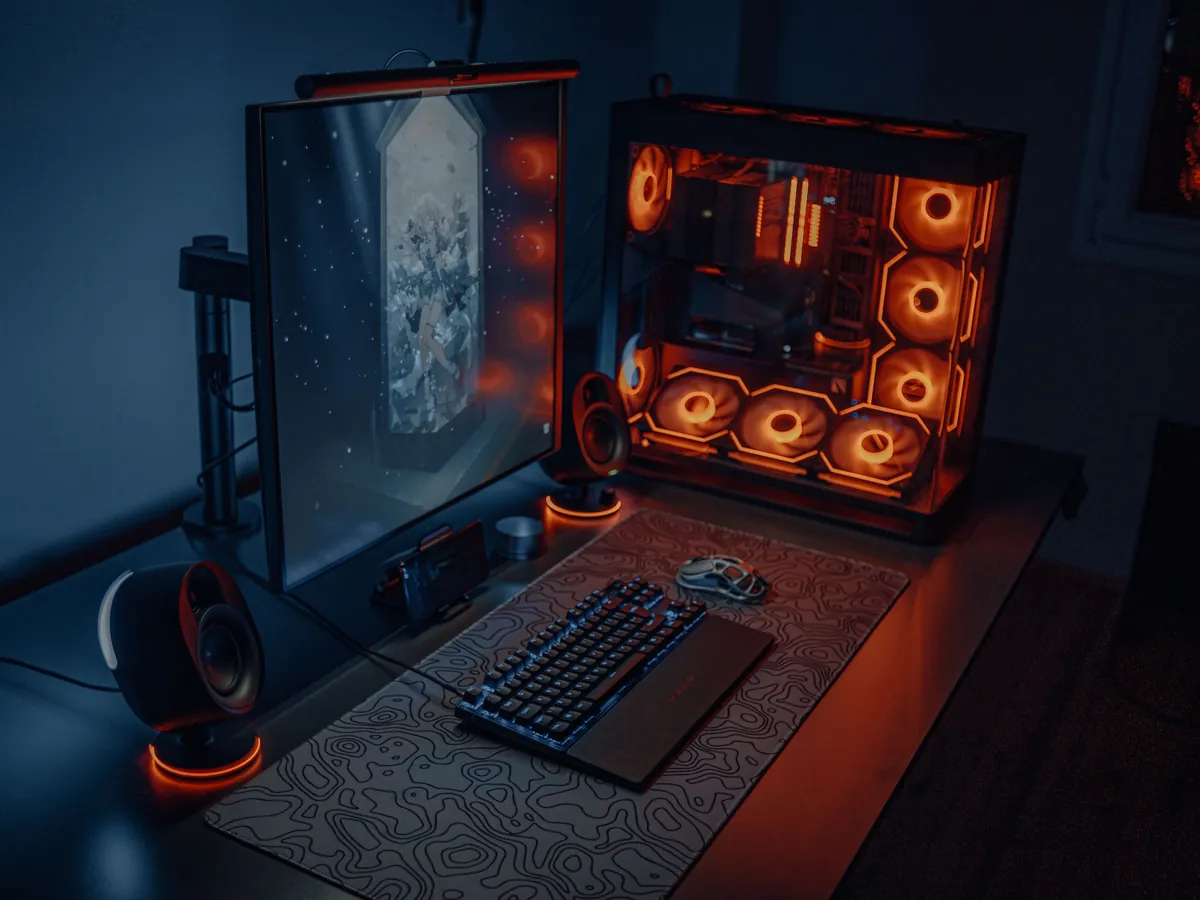
A high-end graphics card alone can draw 300–575 W under load. The rest of the system adds 100–200 W. Frame rate caps and resolution settings directly throttle the biggest component's appetite.
Popular calculators
Updated July 2026 rate dataLiving & Major LoadsSourced from U.S. EIA — Electricity use in homes (end-use shares)
The graphics card is the engine, and uncapped frame rates burn watts to render frames your display may never show, so frame caps are the cheapest saving available. Set your rig's draw and gaming hours below.
EIA residential average, July 2026. Your utility's exact rate is on your bill.
Real-time math: 400 W × your state's rate, accumulating live.
Run like this for a year and it adds about $80 to your electricity bill.
Draw estimates reflect whole-system wall power (CPU + GPU + fans) under gaming load. Cap frame rates and your real figure drops toward the lower presets.
Energy: 1.2 kWh per day · 438 kWh per year, at 18.31¢/kWh (U.S. average).
Wattage is the number that decides everything else. The table below runs the actual figures through this page's calculator at the U.S. average rate of 18.31¢ /kWh, so you can see the running cost jump as the load climbs. Change any value above and the whole page recalculates.
| Watts | Power draw | Per hour | Per month (3 h/day) |
|---|---|---|---|
| 100 W | 100 W draws 0.10 kW | $0.018 | $1.67 |
| 365 W | 365 W draws 0.36 kW | $0.067 | $6.10 |
| 635 W | 635 W draws 0.64 kW | $0.12 | $10.61 |
| 900 W | 900 W draws 0.90 kW | $0.16 | $15.04 |
Basis: July 2026 U.S. average residential rate of 18.31¢ /kWh (EIA Electric Power Monthly, Table 5.6.A). Your state's rate is applied as soon as you pick it above.
A high-end graphics card alone can draw 300–575 W under load. The rest of the system adds 100–200 W. Frame rate caps and resolution settings directly throttle the biggest component's appetite.
Uncapped 200+ fps burns watts to render frames you may not even see on a 60 Hz display. A frame cap at your monitor's refresh rate typically cuts GPU draw 20–40% with zero visual cost.
An 850 W power supply doesn't pull 850 W — it only delivers what the parts ask. Measure real draw with a smart plug meter if you want the exact number; estimates here are wall-draw figures.
Biggest savings first.
About 5–14¢ per hour at the U.S. average rate (18.31¢/kWh) depending on the rig, with most mid-tier systems near 7¢.
At 3 h/day, roughly $6–14/month at the U.S. average rate. Enthusiast rigs (750 W-class GPU systems, 5 h/day) reach $20+/month.
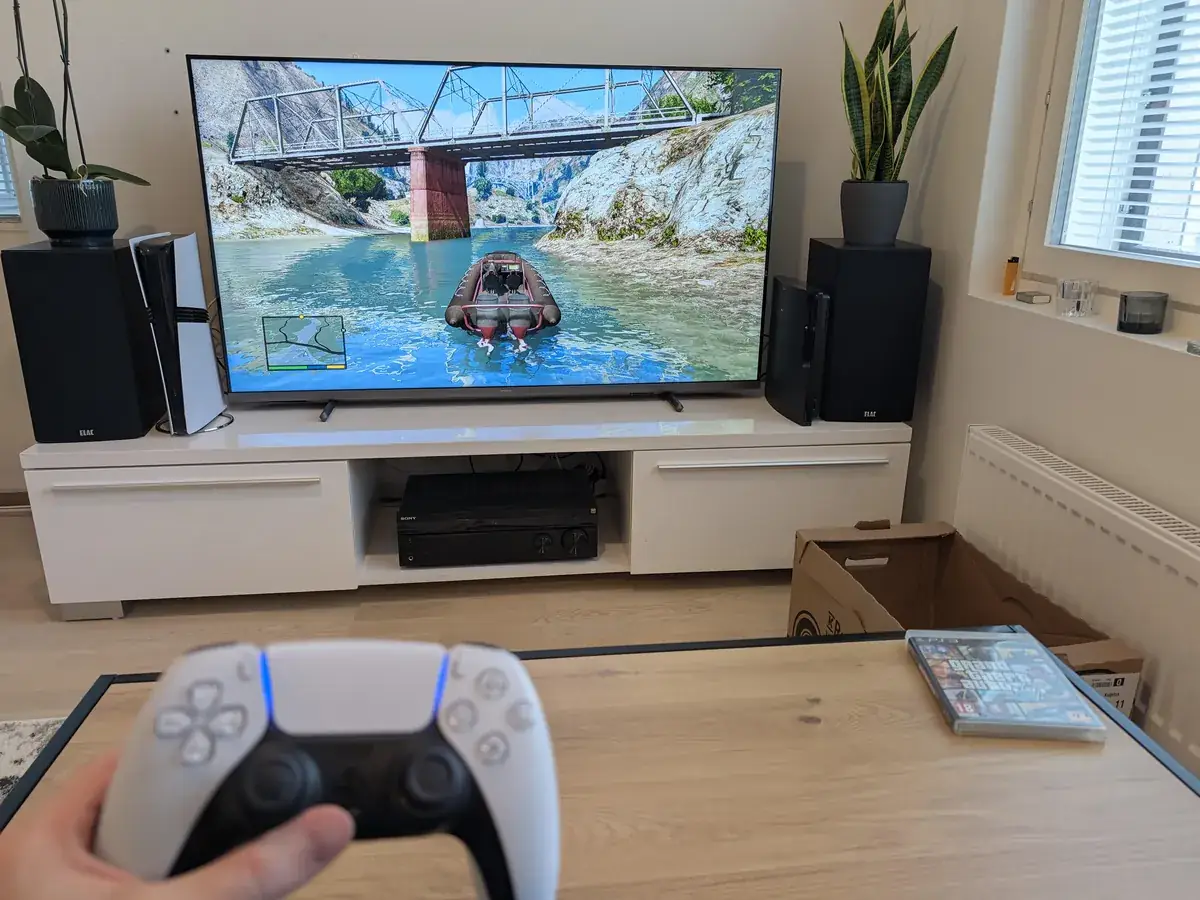
Typically yes — a PS5 draws ~200 W under load vs. 400+ W for a mid gaming PC. Consoles also cap frame rates by design, which is a big part of why they're efficient for the performance delivered.
Rate basis: EIA residential average, July 2026 (retrieved from Electric Power Monthly Table 5.6.A). Estimates are for planning, not billing.